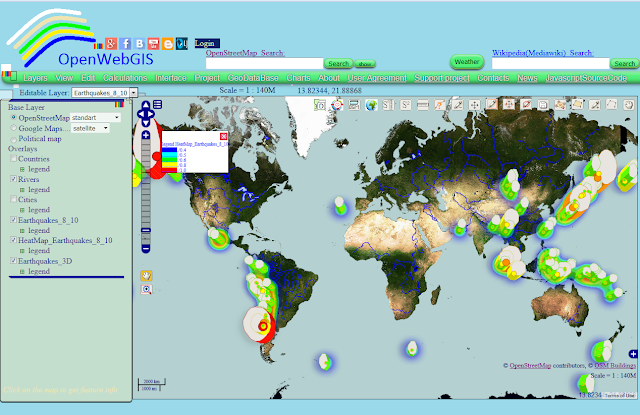
Look at the interesting map of the most destructive earthquakes (
with magnitude of 8 to 10 values) from 1905 to 2014. The data for this map was taken from USGS. USGS is a science bureau within the United States Department of the Interior. It can be available with menu item of
OpenWebGIS:
"GeoDataBase-> Earthquakes Database".
 |
| Figure 1 |
 |
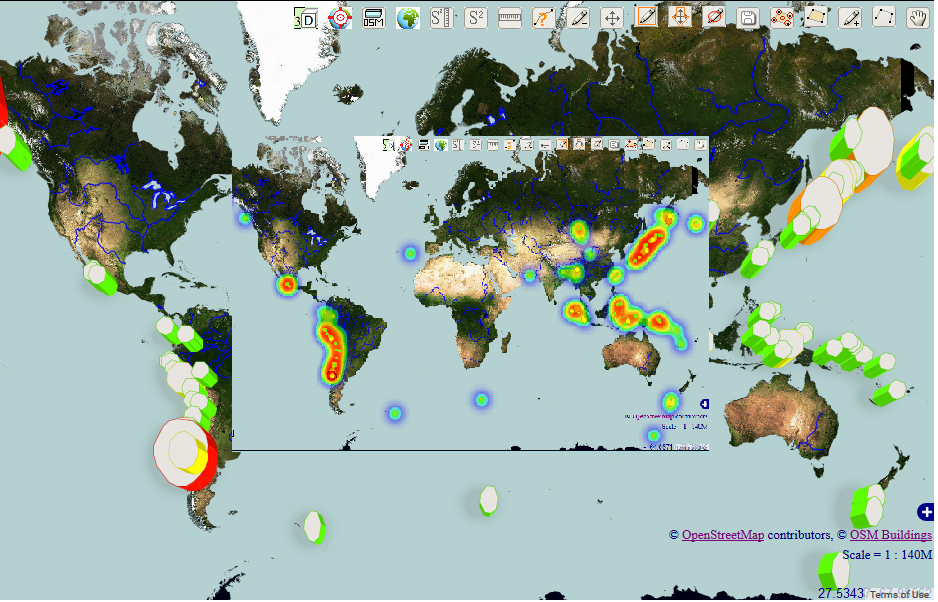
| Figure 2 |
Screenshots of this map are shown on the Figure 1 and Figure 2. The map for online interaction with it you can see at this link:
Map
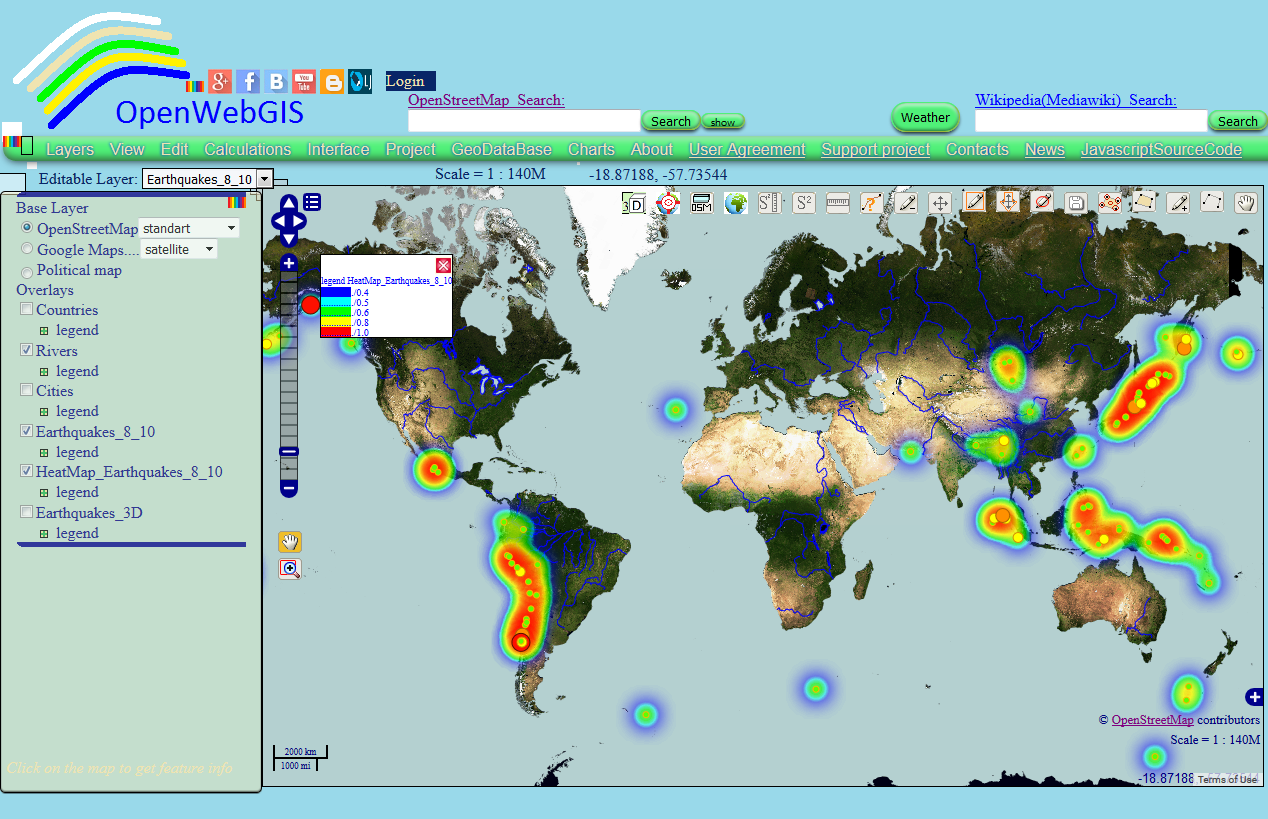
The map is interesting, because it is presents the data in 3 ways:
1. With the help of heatmap - please read about heatmap creation in OpenWebGIS in these articles:
"Heatmap and Interpolation in OpenWebGIS (very easy and interesting)" and "
How to create a heatmap on the map using JavaScript, Openlayers and canvas".
2. With the help of usual points the color of which depends on the magnitude of the earthquake. The values of all attributes of each point you can see by hovering the cursor over it and clicking on it (if while hovering over a point, it is not activated, then move the map a little bit and then again hover the cursor). You need to click on the point of earthquake you are interested in, after that a pop-up window will be opened (See Figure 3). How to create such a color legend you can learn for example from this article:
"Customizing legend of the layer with cluster strategy of OpenWebGIS" if you look at Figures 4,5,6 in it.
 |
| Figure 3 |


No comments:
Post a Comment