The article is written to demonstrate the new capability of creating animated maps in OpenWebGIS using 2.5D columns. Before reading this article I recommend to read another one: Spatial and temporal distribution of earthquakes in Chile and adjacent areas (1960-2015).
Initial data on earthquakes was selected from the database of "EarthquakeArchive Search" with the help of menu item in OpenWebGIS: "GeoDataBase-> Earthquakes Database".
For the analysis we choose a rectangle with coordinates: lower left longitude: -123.461719; lower left latitude: 25.747123; upper right longitude: -66.420703; upper right latitude: 46.458040. Magnitude range: from 4 to 10. Date & Time (UTC): from 1950-01-01T00:00 to 2015-09-27T17:22:46.Results from these selecting options from the database are shown in Figure 1.
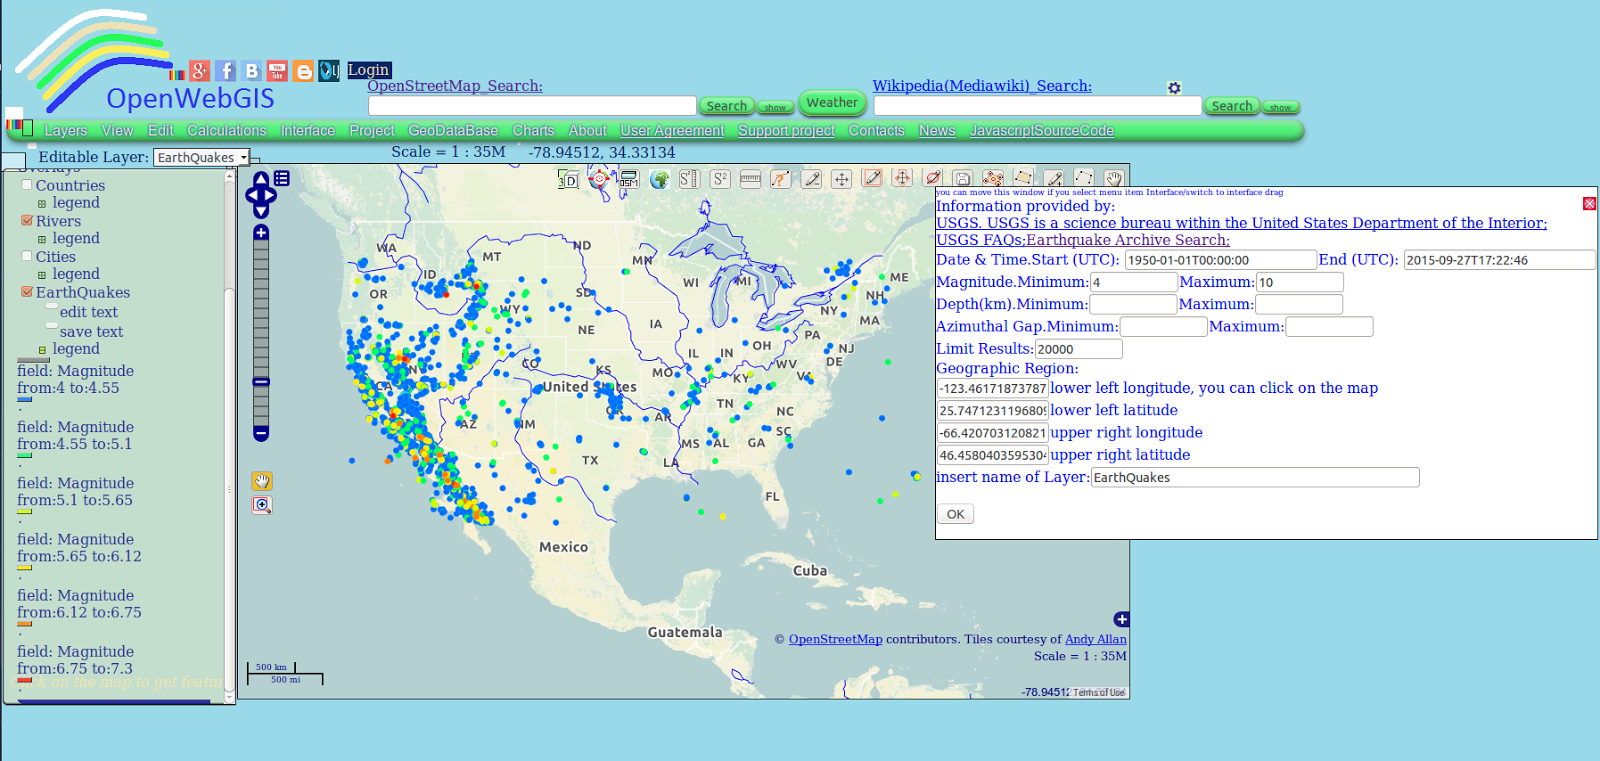 |
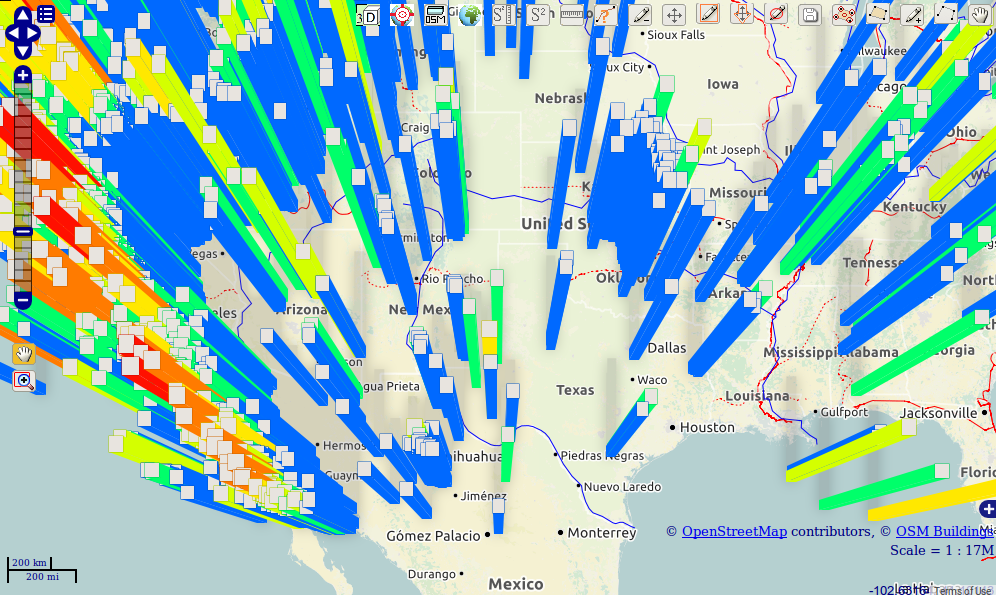
| Figure 1 |
Places of earthquakes are marked by the color according to their magnitude. Layer legend is shown to the left of the map. The interactive map with the results of the selecting is available here.
Now let's see how these earthquakes are distributed in space and by years. For this the new opportunity of "Time Line" function is used. You can now animate the point with the help of 2.5D columns. First, we define the height of the columns.
For this:
1. Select the name of the layer "EarthQuakes" in the "Editable Layer" list.
2. Open the attribute table using the menu item "Edit-> Open attribute table".
3. Create a new attribute for instance called "Height". It will be used to create 2.5D columns. Their height will be calculated in meters above ground level depending on the number of earthquakes in each square. Therefore, this attribute must be created using the formula (Height = [Magnitude] * 150000) shown in Figure 2.
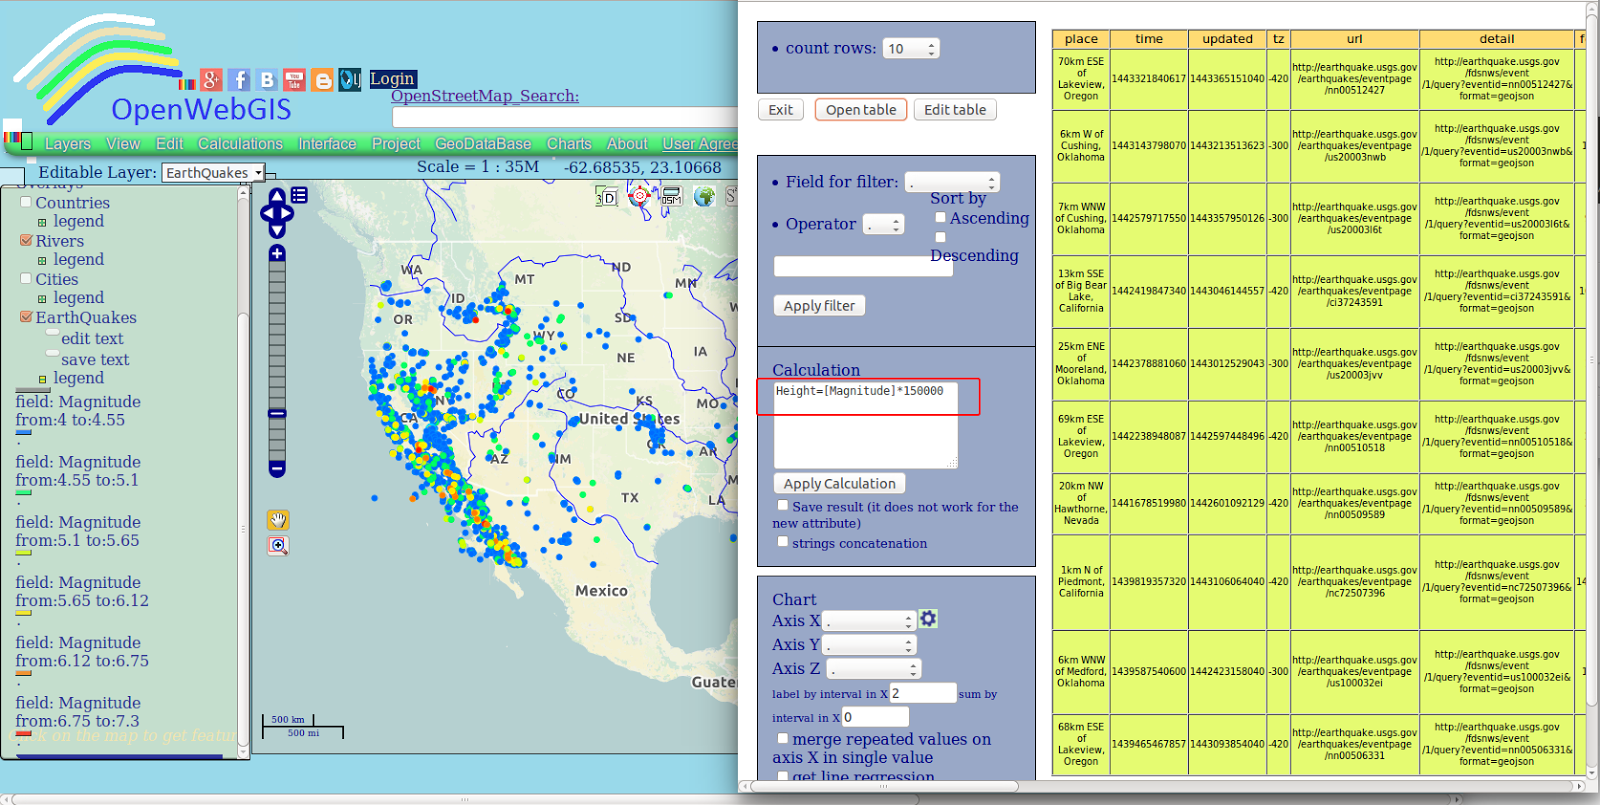 |
| Figure 2 |
Then select menu item"View-> Time Line" and activate the option 2.5D (See Figure 3), then there will be a settings window of 2.5D columns. Set the options as shown in Figure 4. Press "Extrude" button and result will be like shown in the Figure 5.
 |
| Figure 3 |
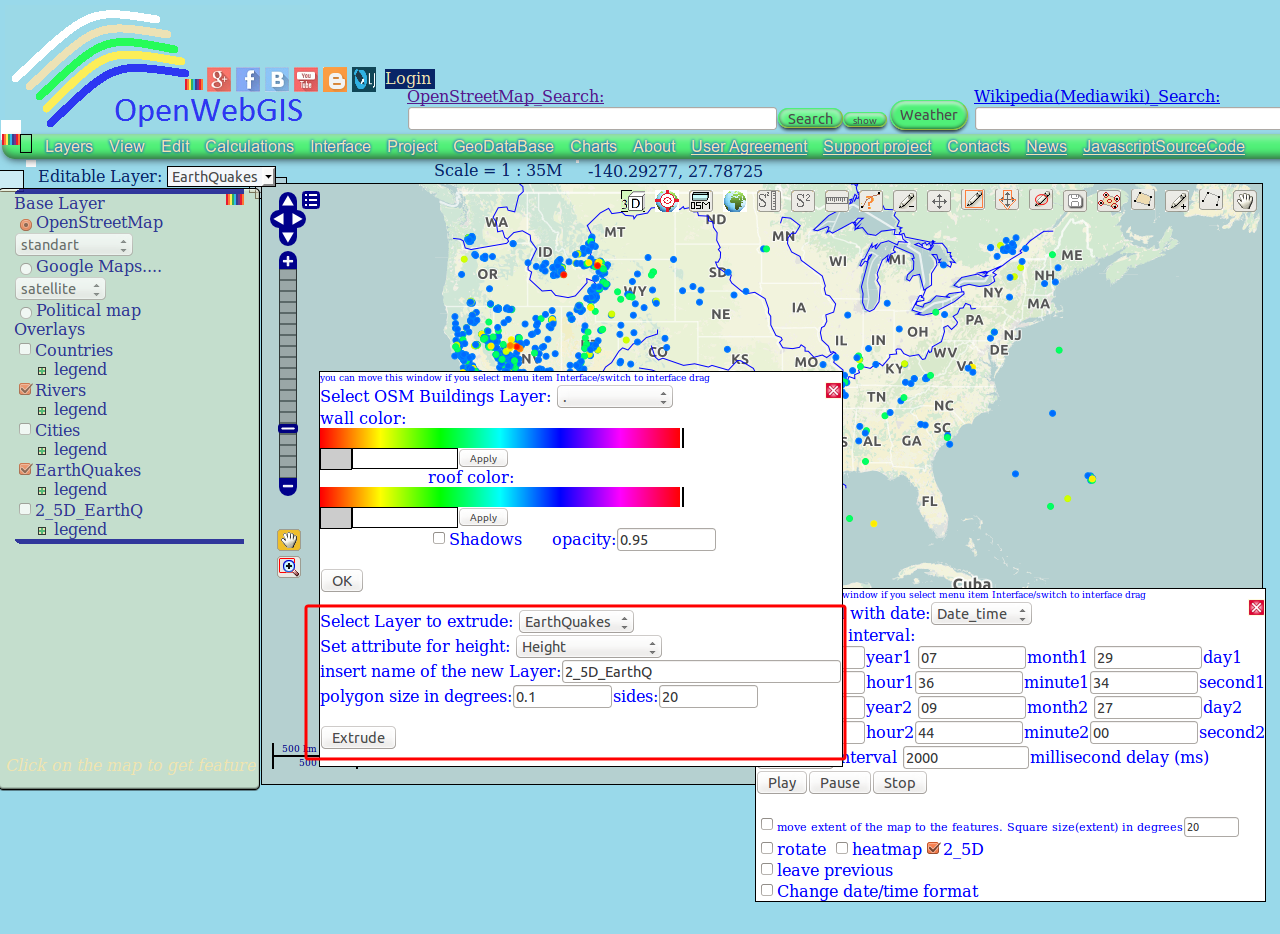 |
| Figure 4 |
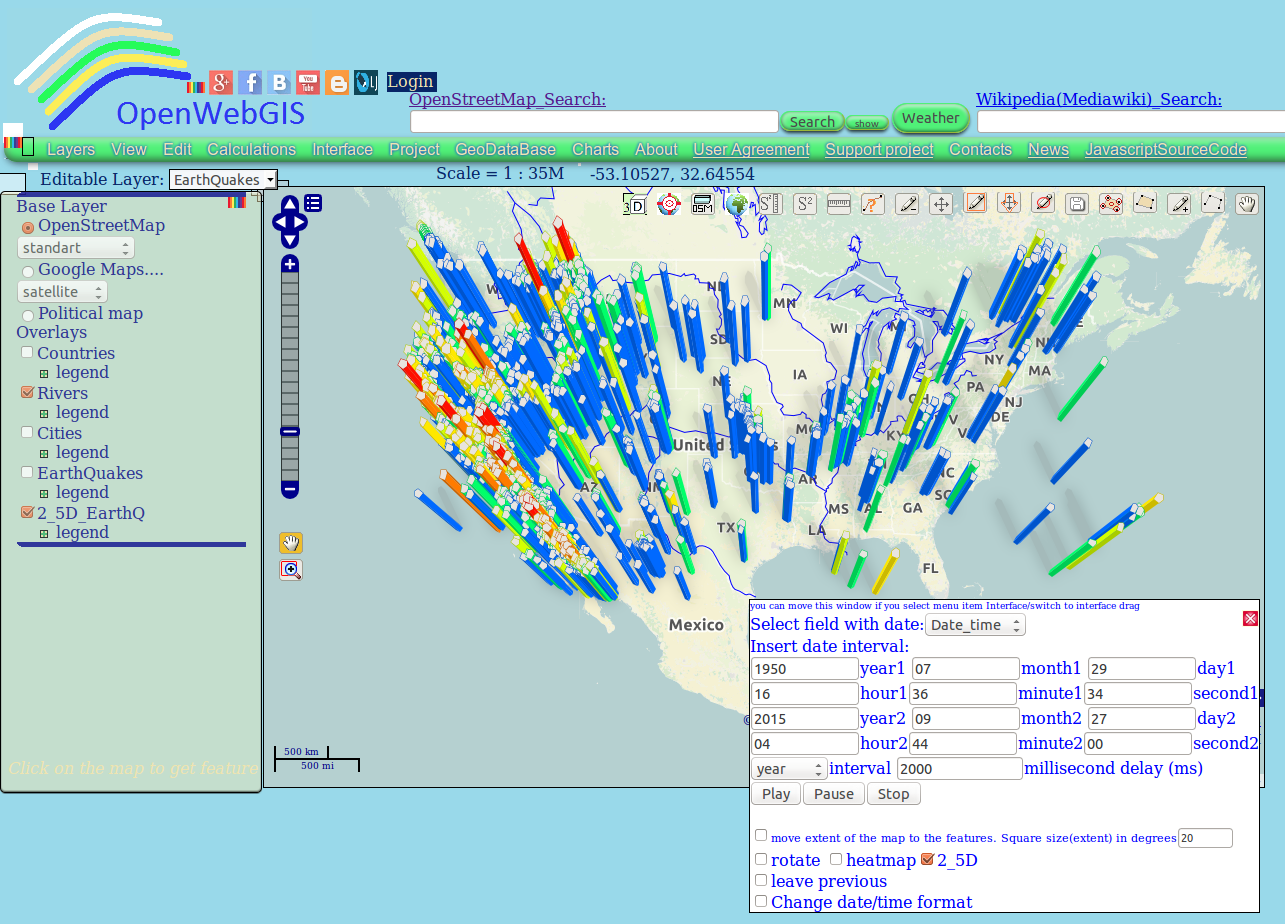 |
| Figure 5 |
 |
| Figure 6 |
The interactive map of the earthquakes animation in the form of 2.5D columns is available here
No comments:
Post a Comment