Initial data on earthquakes was selected from the database of "Earthquake Archive Search" with the help of menu item in OpenWebGIS: "GeoDataBase-> Earthquakes Database".
For the analysis we choose a rectangle with coordinates:
lower left longitude: -80.131640; lower left latitude: -56.006573; upper right longitude: -65.805468; upper right latitude: -16.608122. Magnitude range: from 5 to 10. Date & Time(UTC): from 1960-01-01T00:00 to 2015-09-21T09:48.
For the analysis we choose a rectangle with coordinates:
lower left longitude: -80.131640; lower left latitude: -56.006573; upper right longitude: -65.805468; upper right latitude: -16.608122. Magnitude range: from 5 to 10. Date & Time(UTC): from 1960-01-01T00:00 to 2015-09-21T09:48.
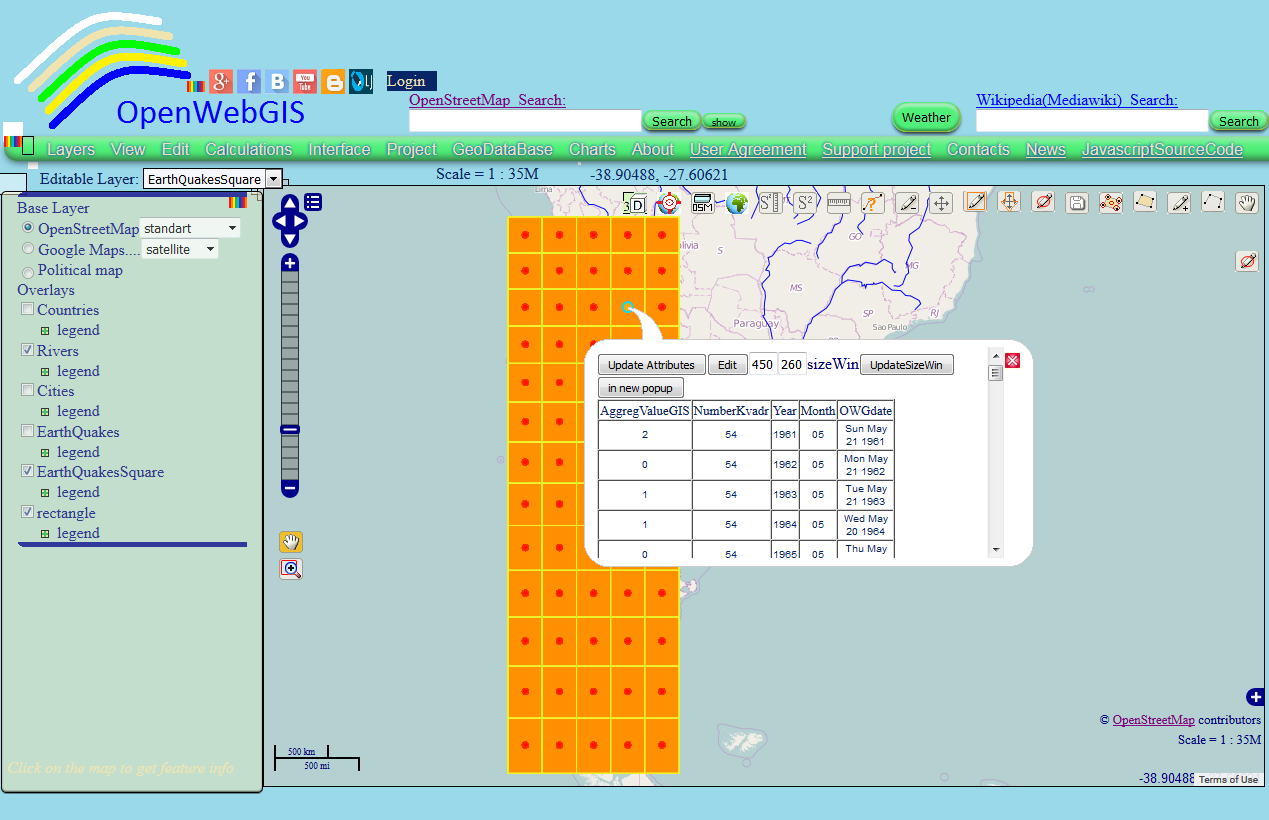
Results from these selecting options from the database shown in Figure 1. Places of earthquakes are marked with orange points.
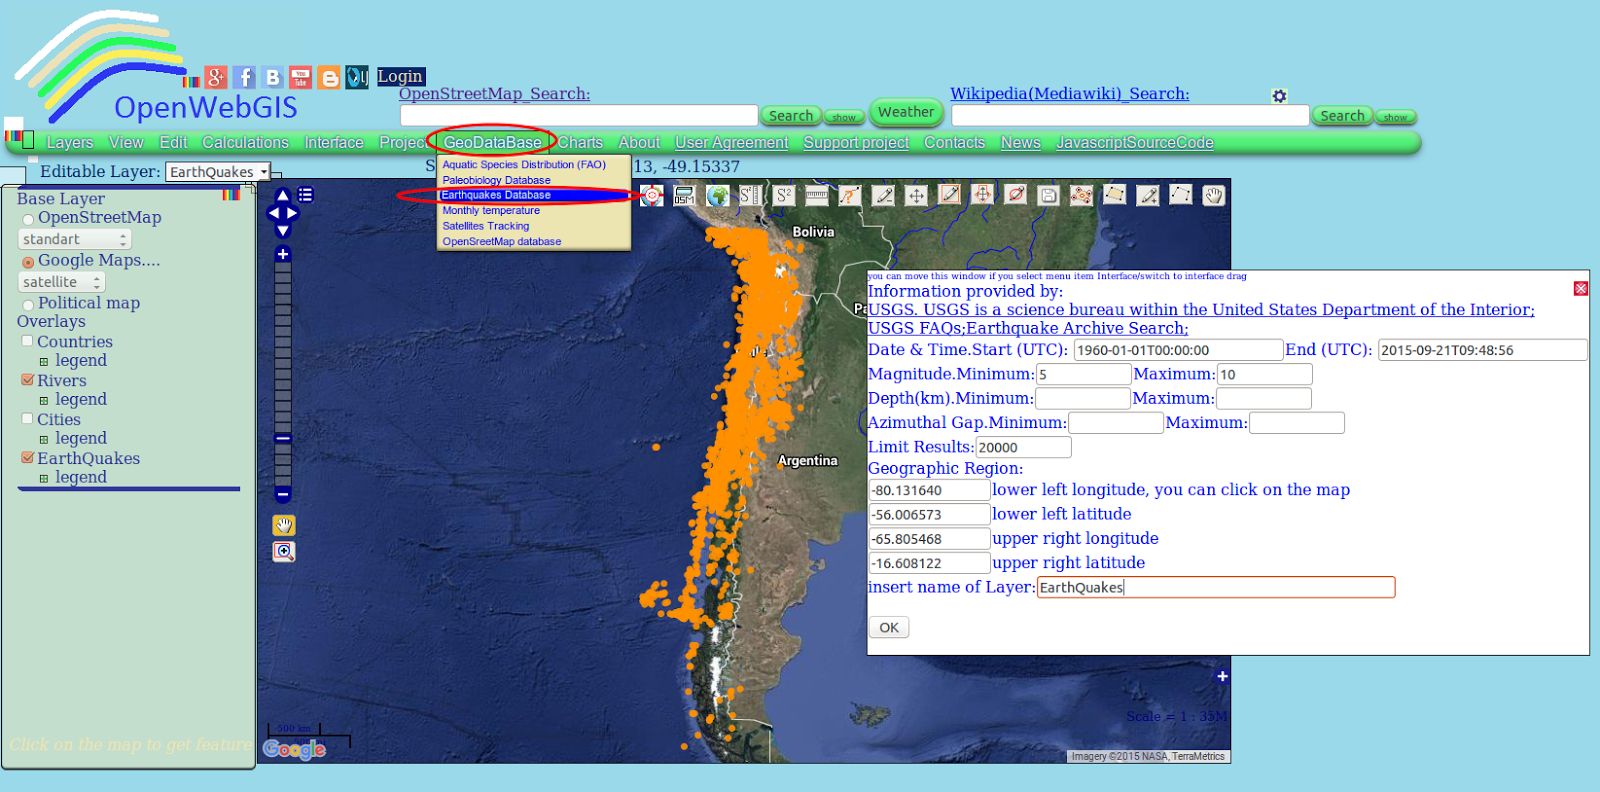 |
| Figure 1 |
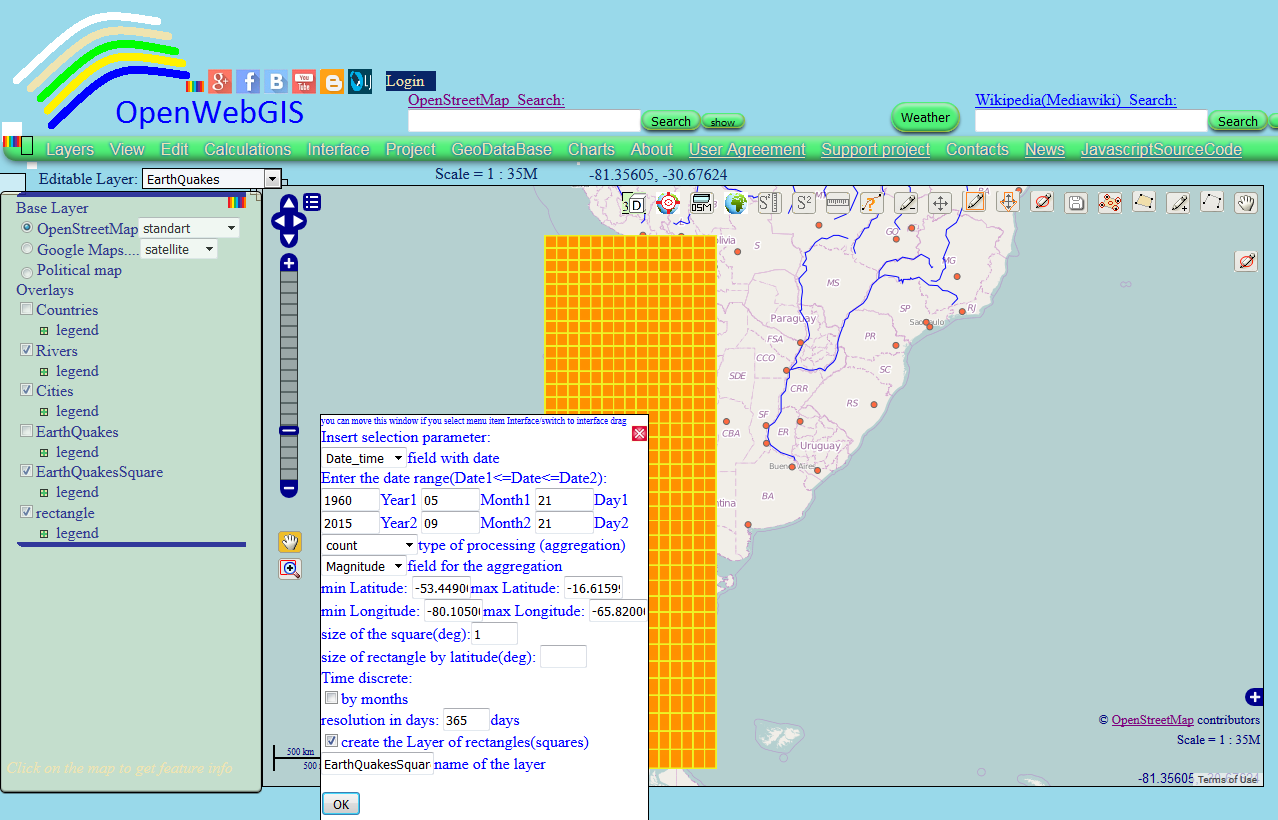
Calculate the number of earthquakes at one-degree squares. To do this,
use the menu item "Calculations->Calculation of the squares". In the
window that appears, set the options as shown in Figure 2.
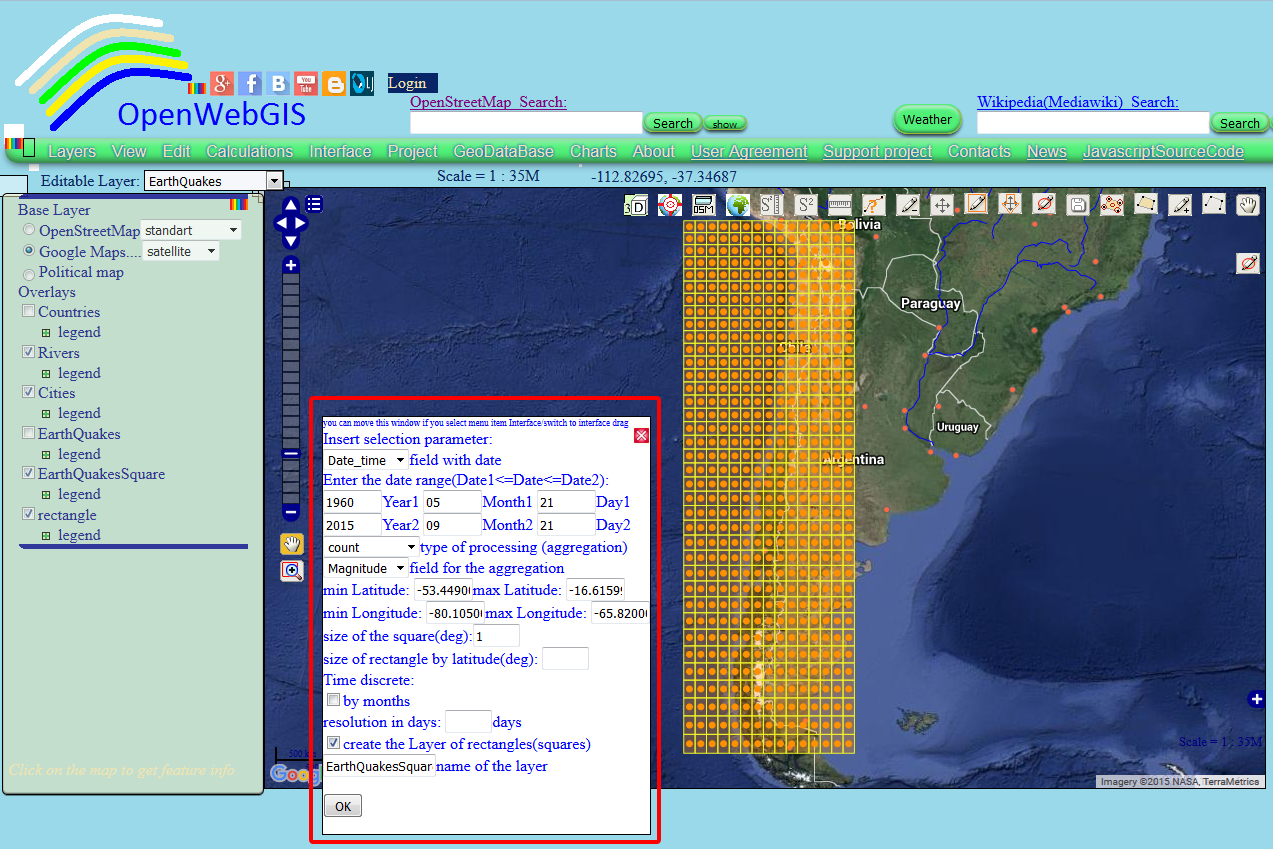 |
| Figure 2 |
The interactive map with the results of selecting and aggregation by one-degree squares is available at this link:MAP 1
Change the layer legend "EarthQuakesSquare" as shown in Figure 3. The number of earthquakes in the layer "EarthQuakesSquare" is contained in the attribute called "AggregValueGIS".
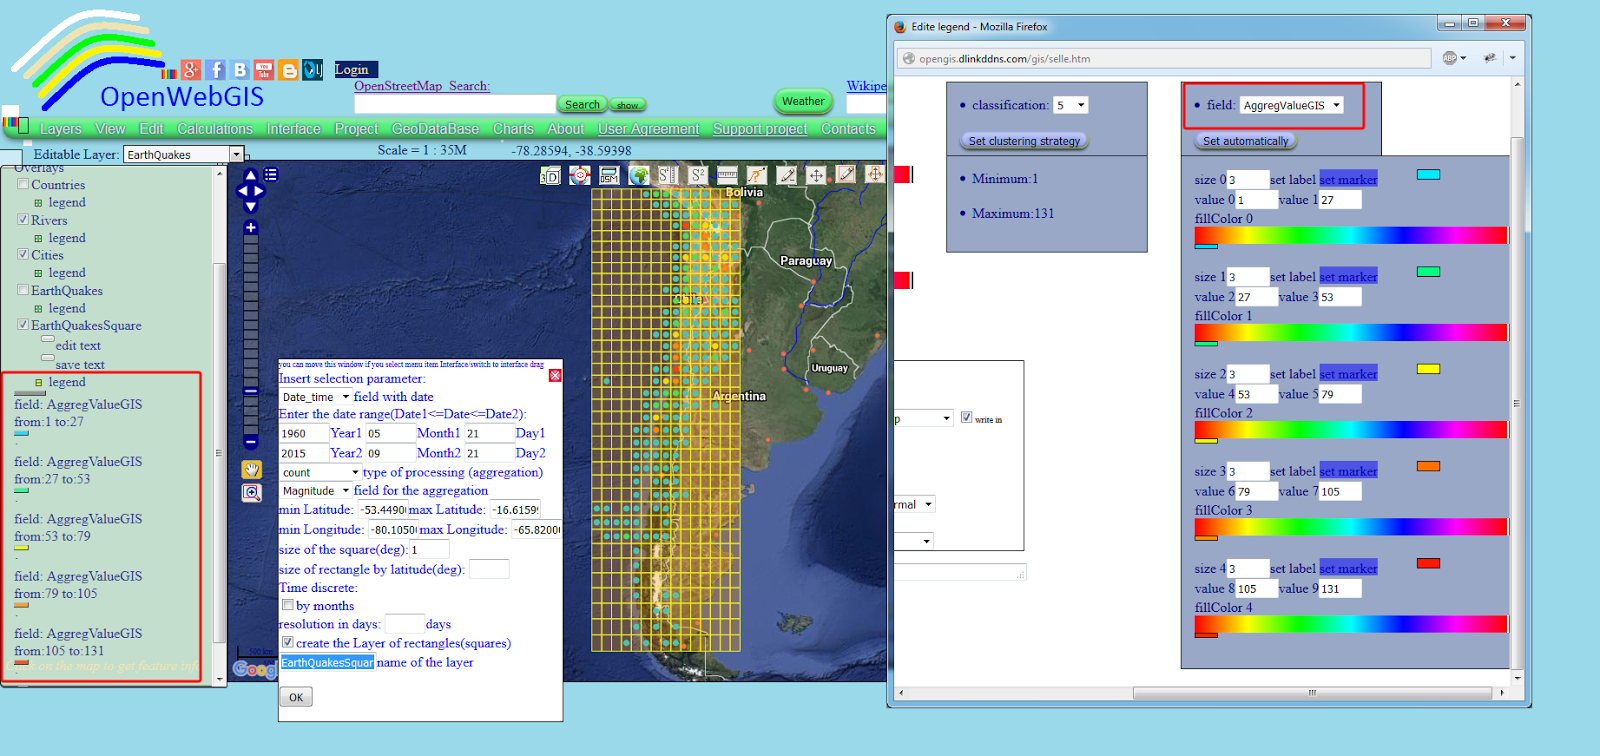 |
| Figure 3 |
Create 2.5D columns showing the number of earthquakes on the map.
For this:
For this:
- Select the name of the layer "EarthQuakesSquare" in the "Editable Layer" list.
- Open the attribute table using the menu item "Edit->Open attribute table".
- Create a new attribute for instance called "Count". It will be used to create 2.5D columns. Their height will be calculated in meters above ground level depending on the number of earthquakes in each square. Therefore, this attribute must be created using the formula shown in Figure 4.
- By clicking on the menu item "Edit ->Edit OSM Buildings Layer" and in the window that appears, set the options as shown in Figure 5. For more information about "OSM Buildings" read here "Integration of OpenWebGIS with OSM Buildings JavaScript library"
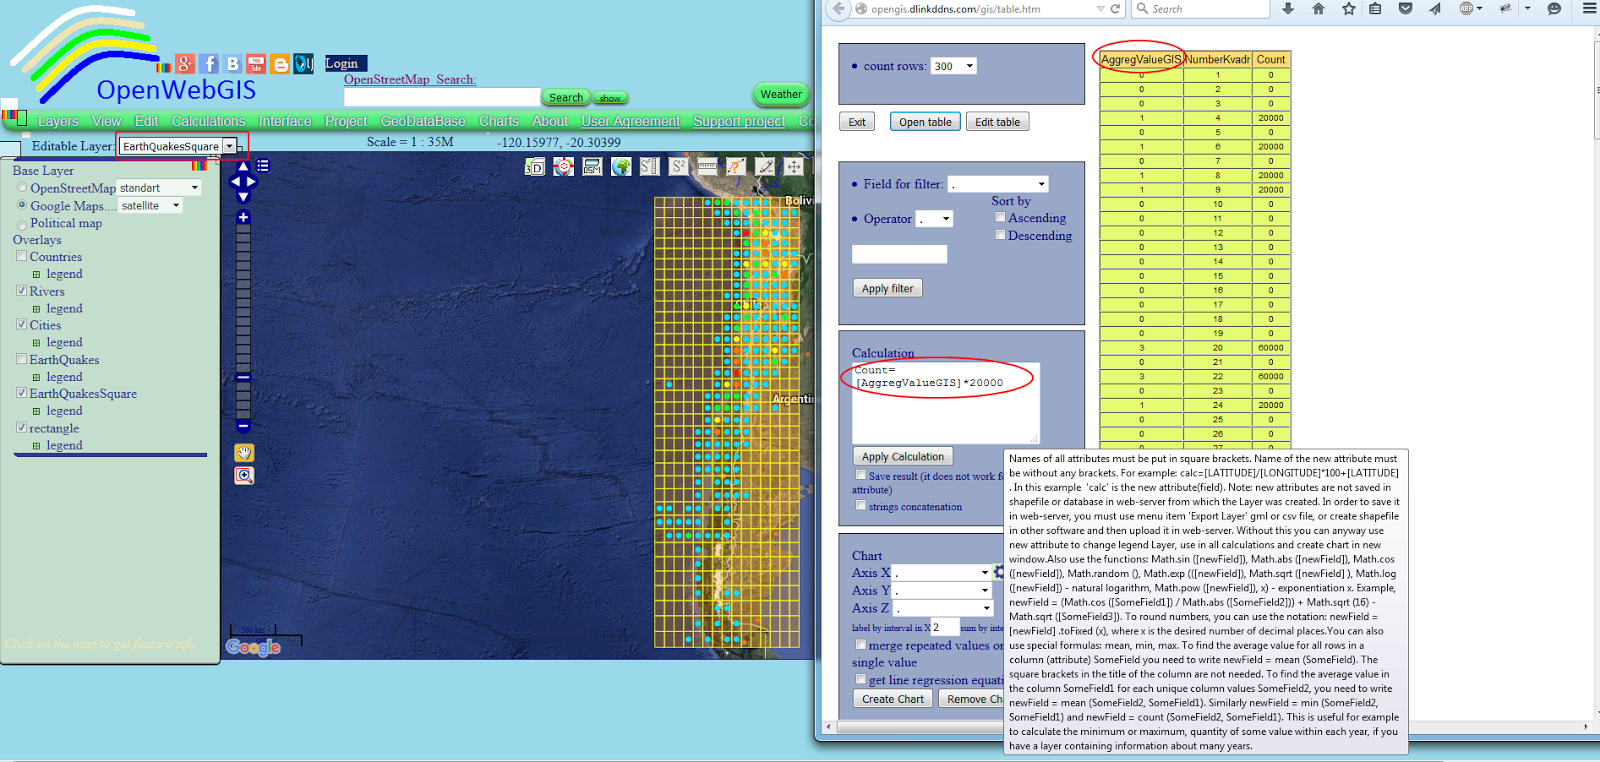 | |
| Figure 4 |
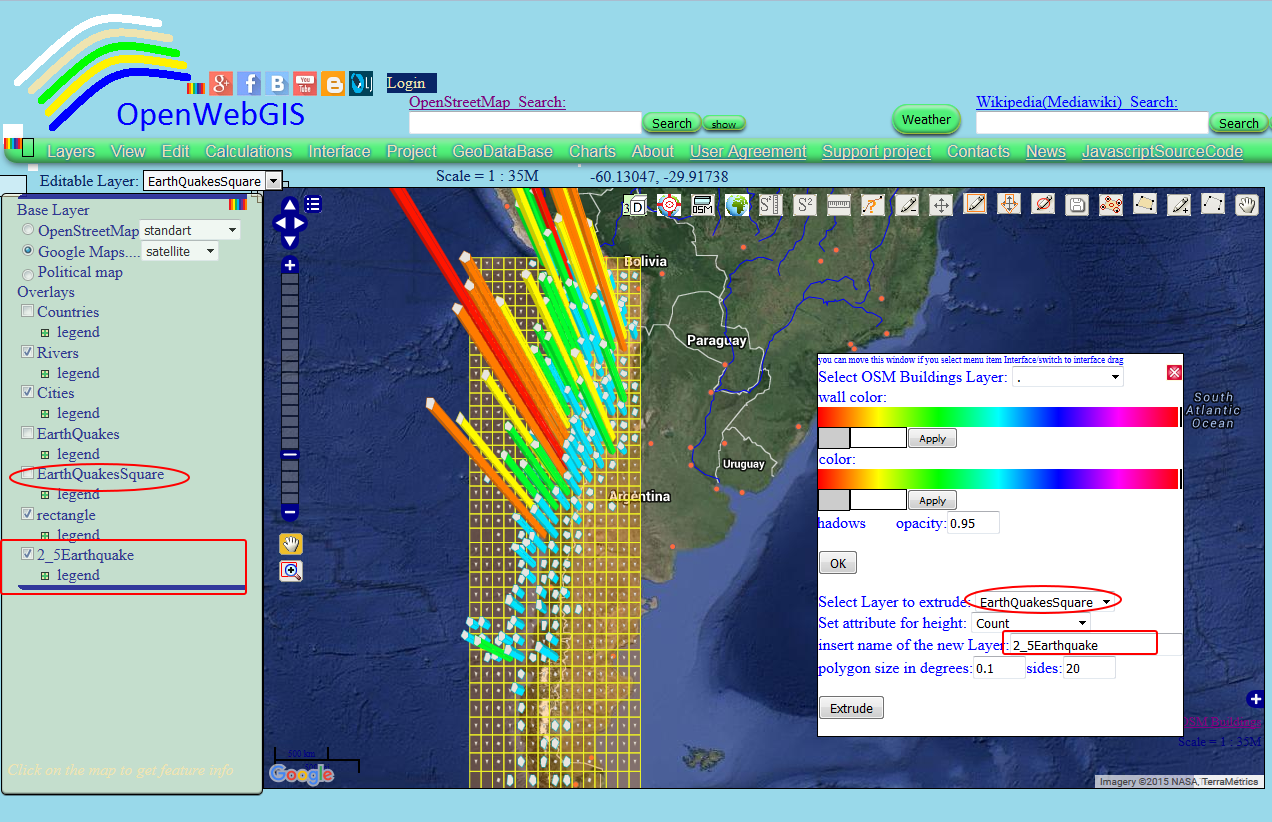 |
| Figure 5 |
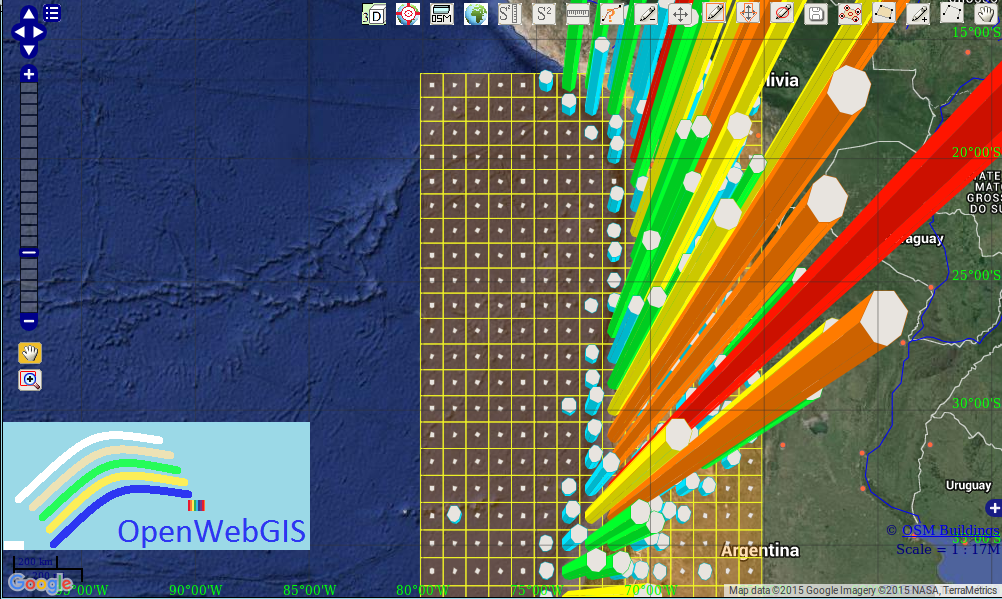
The interactive map with 2.5D columns is available here: MAP 2.
 |
| Figure 6 |
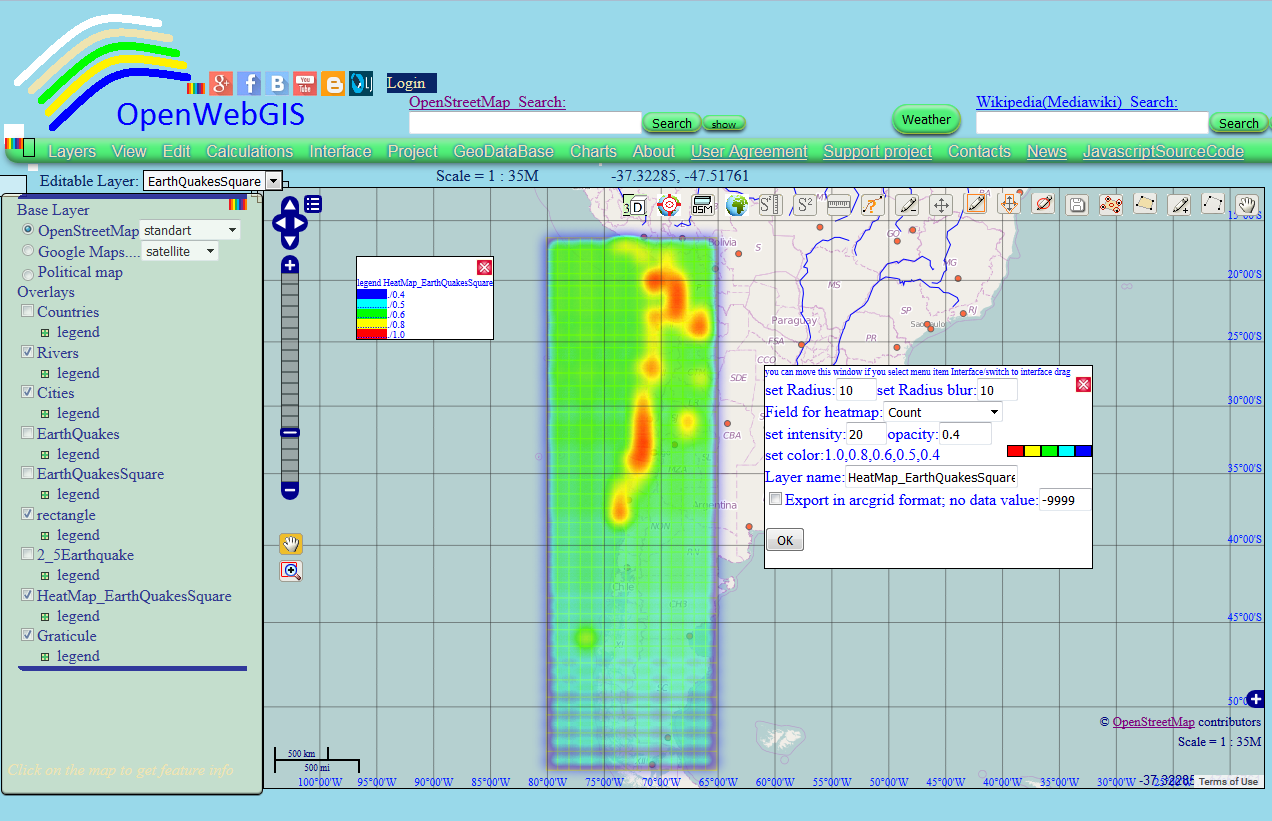
Learn how to create a heatmap, reading here: "Heatmap and Interpolation in OpenWebGIS (very easy and interestingly)".
An interactive heat map is available here: MAP 3.
Now let's analyze the change in the number of earthquakes in time (years) in one-degree squares. To do this, set the options of "Calculations->Calculation of the squares" window as shown in Figure 7.
 |
| Figure 7 |
The resulting (calculated) layer has the rows of undetermined dates (i.e., these squares have no data) (see Figure 8).
 |
| Figure 8 |
In order to use the "Time Line" function it is necessary to create a layer, that does not contain these rows. To do this, use the menu item "Layer->New Layer from selected or filtered" and in the window that appears, specify the settings as shown in Figure 8 and click "OK" button.
In the "Editable Layer" list, select the name of the newly created layer "Earthquakes_year". Then select the menu item "View->Time Line". We do it in the way described in the article "200 million years of the dinosaurs life (sauropods) in a few seconds on the map"
The result of your actions will be as shown in Figure 9 in the video below, and on and interactive map available at the link here: MAP 4
 |
| Figure 9 |
Now let's analyze (decompose the time series into the sum of interpretable components such as trend, periodic components) time series of earthquakes in some square and possibly even predict the number of earthquakes in this square for the coming years. But for this, as it seems to us, it is better to take not one-degree squares, but for example three-degree ones. So make a new calculation by the squares. The result will be as shown in Figure 10.
 |
| Figure 10 |
The interactive map with three-degree squares is available here: MAP 5.
In OpenWebGIS for time series analysis method is used the singular spectrum analysis (SSA). This method is available in the menu item "Calculations-> Time and matrix analysis". Briefly it is written about it in this article, "Look into the future with the help of OpenWebGIS".
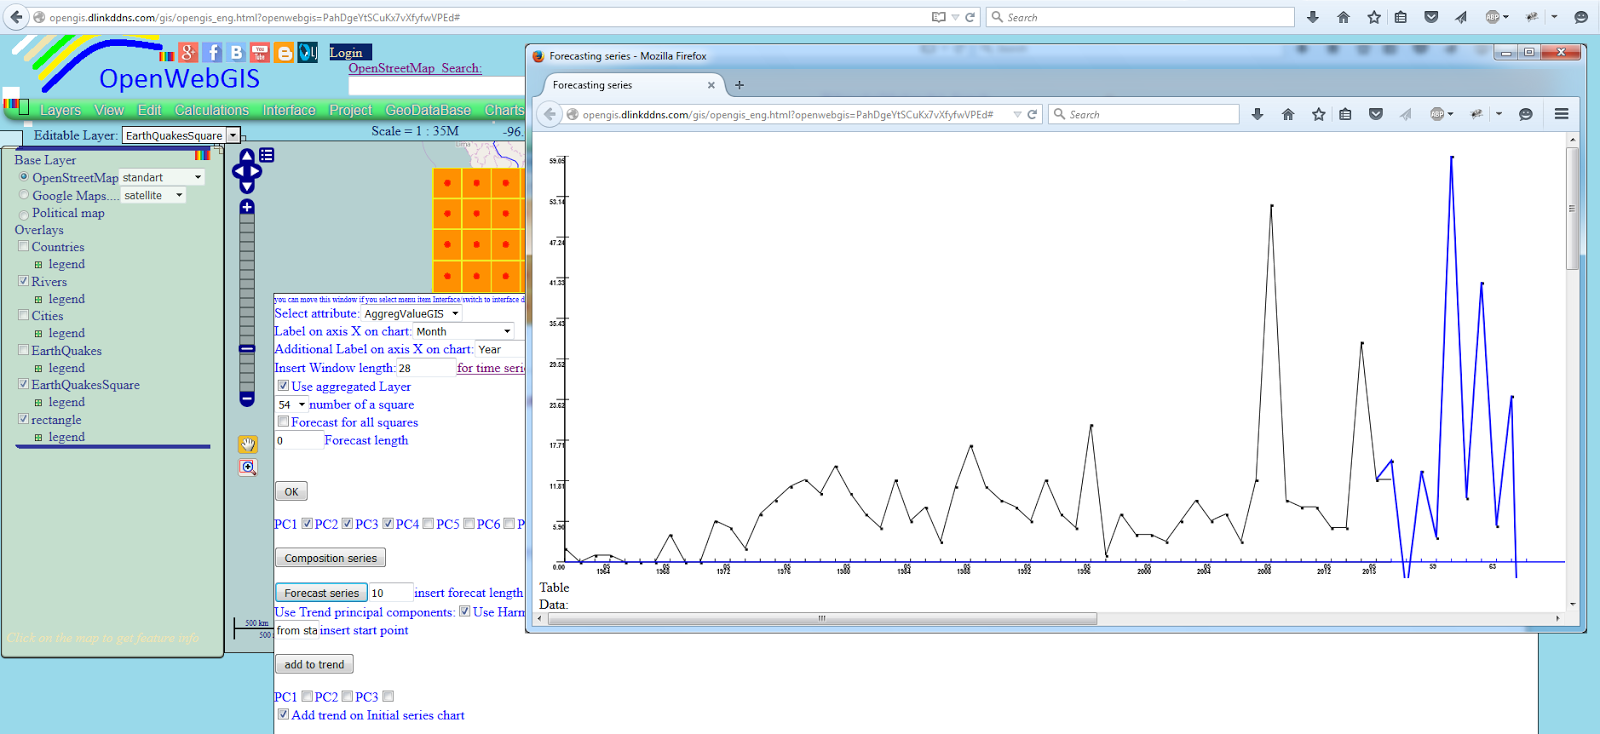
For the analysis we choose the square number 54 (highlighted in Figure 10). In the options function "Time and matrix analysis" specify the length of the window equal to 28. The result is shown in Figure 11.
For the analysis we choose the square number 54 (highlighted in Figure 10). In the options function "Time and matrix analysis" specify the length of the window equal to 28. The result is shown in Figure 11.
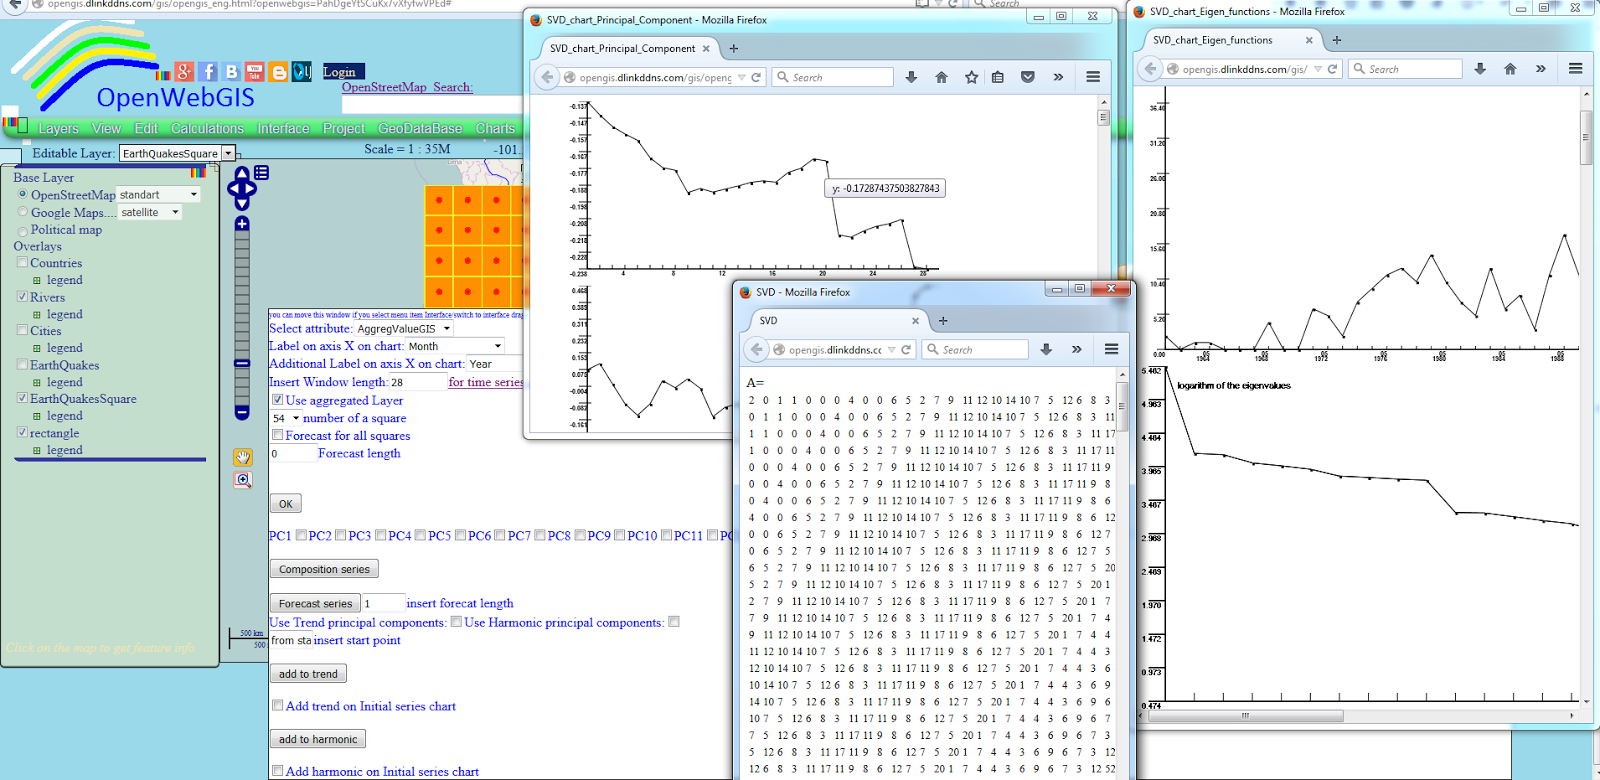 |
| Figure 11 |
To create the trend take the first principle component, for periodic let`s take the second principal component. The result is shown in Figure 12.
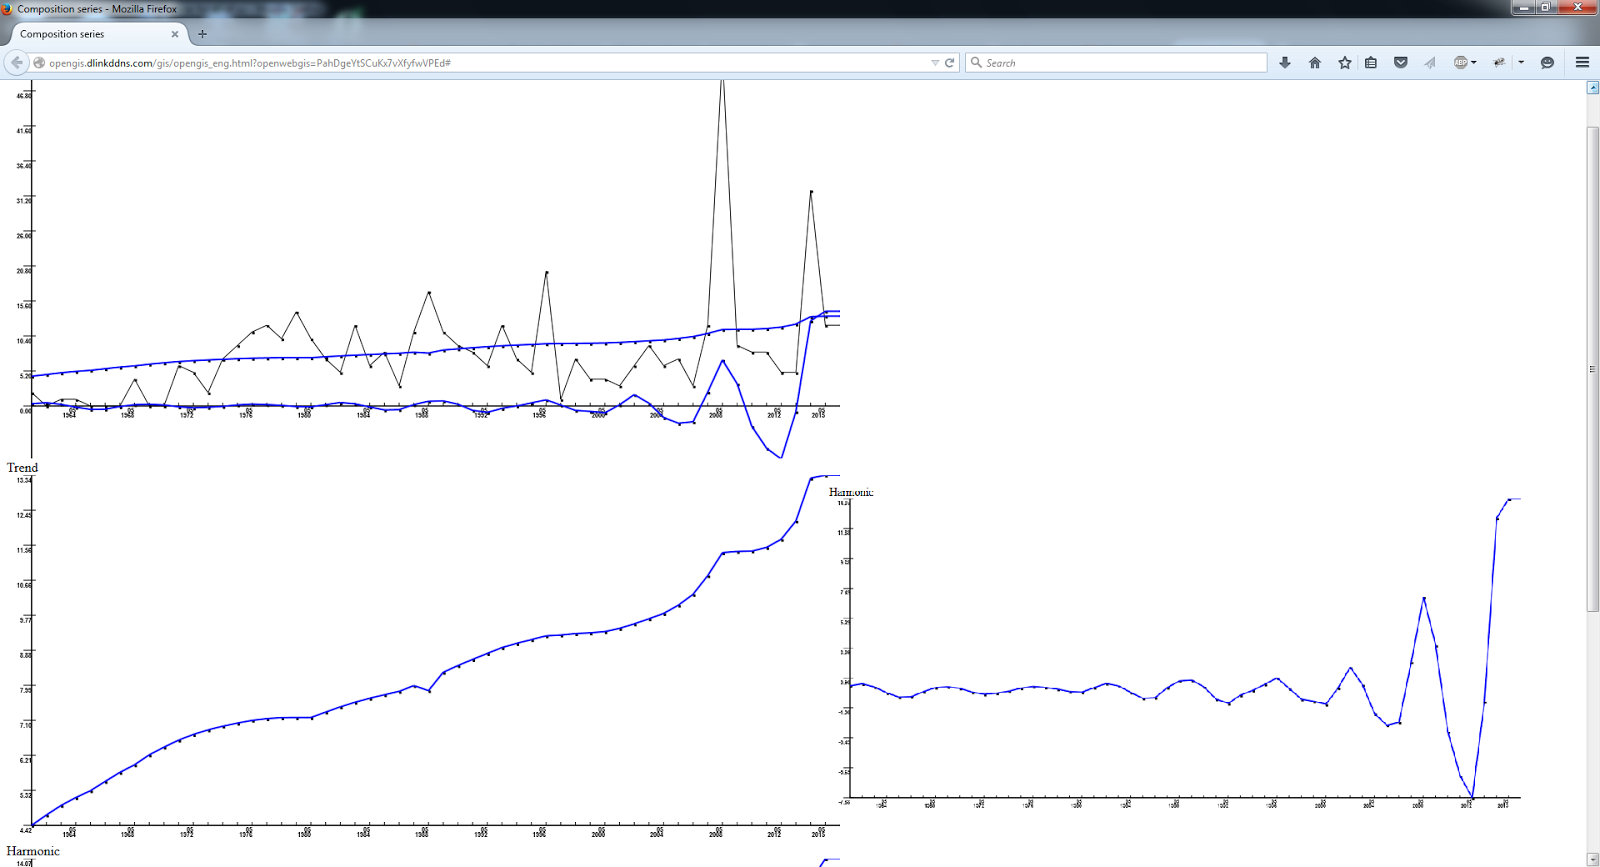 |
| Figure 12 |
 |
| Figure 13 |
This article does not pretend on any scientific conclusion about earthquakes. It only shows technical and analytical capabilities of OpenWebGIS. If you have any questions on the content of this article, then perhaps you will find the answer here: "List of articles about OpenWebGIS in chronological order (descending) according to their writing"
No comments:
Post a Comment