
Free online geographic information system (GIS)
called OpenWebGIS provides an
opportunity to sample data from the Paleobiology Database (Paleontological
database). This was described in detail in the article "The information tools(data base and GIS) to help paleontologists in their scientific researches". You can make your selections and apply them
automatically on the map using the menu item of OpenWebGIS "GeoDataBase->
Paleobiology database".
OpenWebGIS has various functions to analyze
these and other data. For example, users can create animated maps based on
attribute with the date/time values. This is described in detail in this
article: "Embedding animated maps of OpenWebGIS in your sites".
Until the last moment, all the articles on OpenWebGIS stated that: "Dates/times in the field with date must be in format ISO8601: yyyy-mm-ddThh:mm:ss
(for example:'2015-09-17T18:00:00'). It is necessary for
animation in OpenWebGIS. "
It is well understandable. But how to animate
your data if you do not have detailed information about the months, days,
minutes, and, for example, there is only a list of years (1996, 1997, 1998 ...
2015)? Let`s assume it can be solved by adding to the data field with the years
the following string ('-01-01T00: 00: 00'). But thus how to animate processes
that lasted millions of years?
And in OpenWebGIS an enhanced version of "Time
Line" function has appeared. Now, as a field containing the date the user
can select any field containing "Numeric" data type. Let's show how it works on the example of
information about occurrence Sauropods
fossils selected from the
Paleobiology database. Sauropods are an infraorder of saurischian
("lizard-hipped") dinosaurs.
Selection parameters and the result on the map of selecting is shown in
Figure 1. The points are colored according to the value of the "early_age"
field (attribute). Early_age is the early bound of the geologic time range
associated with this occurrence (in Ma (millions).
 |
| Figure 1 |
Further, we choose the name of the resulting
layer "Sauropoda" in the list of "Editable Layer" and click
on the menu item "View->Time Line", specify the parameters in the
window as it is shown in Figure 2, then activate the option
"heatmap". Learn how to create an animated heatmap, read here: Heatmap and Interpolation in OpenWebGIS (very easy and interestingly).
 |
| Figure 2 |
After setting all the desired parameters, click
"Play" button and you will see what is shown in Figure 3, 4 and the
video below. You will see how the distribution and the number of finds fossils
of Sauropoda depending on early bound of the geologic time range associated
with this occurrence. Millions of years will change in the window "Time
Line" in red rectangles in Figure 3. We set the parameters of "Time
Line" so that every 2 seconds time interval "early_age" is changed to
30 million years. Changing of the time comes from the later to the earlier
fossils age (new), so we set the negative range (-30).
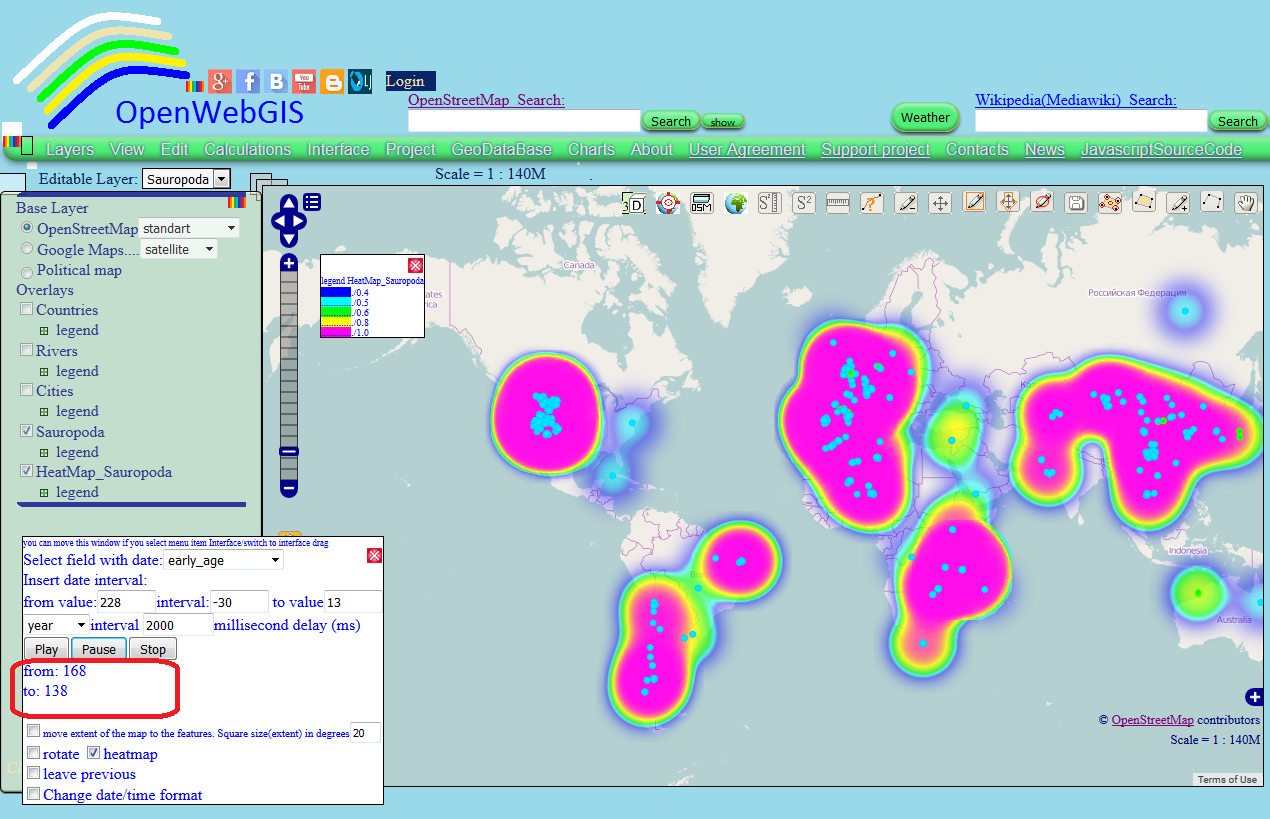 |
| Figure 3 |
 |
| Figure 4 |
Ready interactive animated map with already established all necessary parameters, you can see at this link: Interactive MAP
We supplement the analysis of the animated map
with the chart of the number of fossil discoveries according to their age. The
chart is shown in Figure 5. The chart is created in OpenWebGIS using the menu
item "Edit->Open attribute table"
 |
| Figure 5 |
From the map and chart it becomes clear that
Sauropods first appeared in the late Triassic Period (about 228 million years
ago, it is marked on the chart by an arrow with the number 1). The greatest
diversity of sauropods reached in the Middle Jurassic period (174-157 million
years ago) and Late Jurassic (Oxfordian), allowing many different types (marked
by an arrow on the chart with the number 2). By the end of the Jurassic species
diversity begins to decline slightly (indicated by the arrow on the chart with
the number 3). At the beginning of the Cretaceous period (about 145-140 million
years ago) Sauropods have inhabited the territory of almost all continents -
Africa (Brachiosaurus), North America (Apatosaurus, Diplodocus), Europe
(Xenoposeidon) and Asia (Qiaowanlong). In the
Late Cretaceous period (93-66 million years ago, marked by an
arrow on the chart with the number 4) there is a real surge (especially on the
southern continent, where competition between ornithopods was minimal). The
main variety in this period represents a group of titanosaurs. Conclusions about
the species composition Sauropods can be drawn from the analysis of attribute
table shown in Figure 6.
 |
| Figure 6 |
It is worth mentioning that in the results of
selection from Paleobiology database turned out to be some records (in number
of 47 from 2338) which "early_age" attribute was less than 21 million
years. Although "late_age" (The late bound of the geologic time range
associated with this occurrence) is in the range of 93-126 million years. It is
known that according to the modern scientific opinion Sauropods became extinct
about 66 million years ago. Therefore, these strange values "early_age" of
47 records may be explained by specialists paleontologists, or it is inaccurate
and may simply be excluded from consideration. This article doesn't pretend on any scientific conclusion about dinosaurs. It only shows technical and analytical capabilities of OpenWebGIS
Paleobiology database has a powerful API and
allows you to configure very subtly search the database, if you want to use
OpenWebGIS for specify additional parameters of the selection from Paleobiology
database, please contact us and we will do it, and add new opportunities to the
interface.
Best regards, developers of OpenWebGIS.
No comments:
Post a Comment